
By, Steve Finkelstein – Senior Partner
Develop Strategies and Metrics

In Part I of this three part series we addressed our readiness for growth by completing a SWOT analysis of our sales organization – people, process, strategy and technology. Then we developed actions to leverage our strengths, address our weaknesses, seize our opportunities and mitigate our threats. Part II will focus on developing our strategy and the key metrics to monitor progress and establish accountability for results.
So, what is your sales strategy for growth? What are the right questions we need to ask and answer? A few of the basic questions are below:
- Why do we want to grow? Increase profits, gain market share, etc.
- What are the future trends and what are their impacts – both positive and negative? Competition, economy, technology, etc.
- How much do we want to grow? Dollars, percent, etc.
- What is our competitive advantage? What is our differentiation?
- What does growth look like for our company in 3 years? # of customers, product mix, # sales people, etc.
- How do we want to grow? Products, services, new geographies, new customers, etc.
To assist you in answering the last question, below is the 9 Grid Sales Matrix Analysis Tool. This matrix is my favorite approach to help prepare the detailed type analysis to develop a solid approach going forward. It forces the thought process and discipline to answer the questions for both today and in the future. Below is the matrix and the questions each square asks. The top of the matrix represent the customers, and the left side of the matrix represents the product and services.
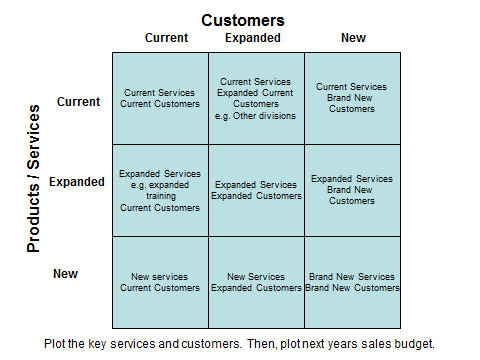
Plot the key services and customers. Then, plot next year’s sales budget.
Let’s take this example sales strategy below.

The below example should be completed for both the current year plus for the next 3 years.
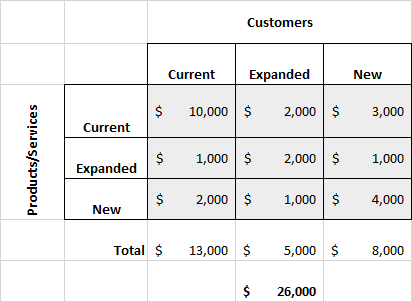
Now, let’s look at what the analysis tells us. Does this make sense? Does it seem reasonable based on your readiness?
SUMMARY – SALES ANALYSIS
- $13,000 or 50% of sales were to current customers
- $5,000 or 19% of sales were to expanded customers as additional divisions were sold to.
- $8,000 or 31% of sales were new products and new customers
ADDITIONAL STRATEGY QUESTIONS
- How do we further penetrate, expand our footprint, in our current clients?
- What are the needed new products of the future? What is our development strategy?
- When do we need to introduce those products?
- What does our sales force mix need to look like? Hunters versus Farmers.
- When do I add another sales person?
SALES METRICS
What gets measured gets done! What gets measured gets attention! If you don’t measure it you can’t improve it? Below is a simple sales organization balance scorecard. In addition, each salesperson should have a scorecard that aligns with and adds up to the total sales organization scorecard.
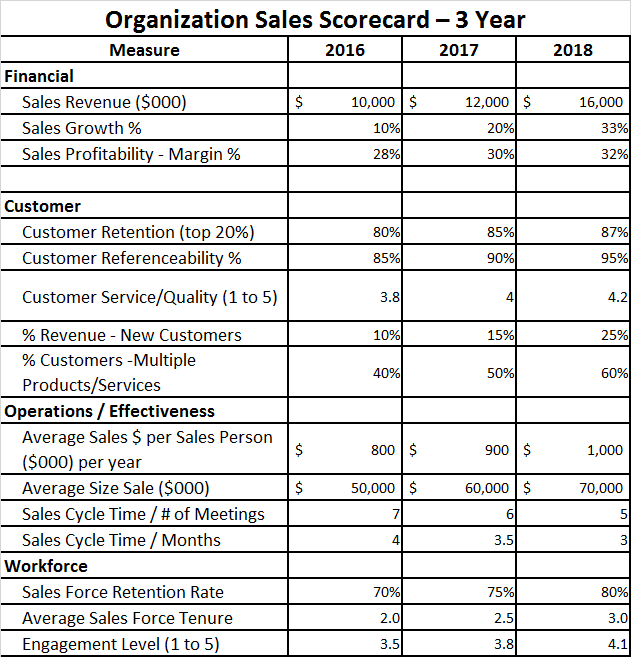
What does your scorecard look like? Do you have measures in the four areas of the Balanced Scorecard?
We hope both this article and Part I provided some valuable tools help your organization get ready for growth and then develop an effective strategy to grow yur business. Also, to help you develop the right metrics to drive the right behaviors and monitor results.
Our next newsletter will cover Part III – Developing a Sales Planning and Execution. This will include a Sales Strategy format that will help clearly articulate your strategy.
If you have any questions please contact Steve Finkelstein, Sr. Partner, Experience on Demand. Also, if your would like to discuss how we could help administer the survey and facilitate a working session for your organization let us know.